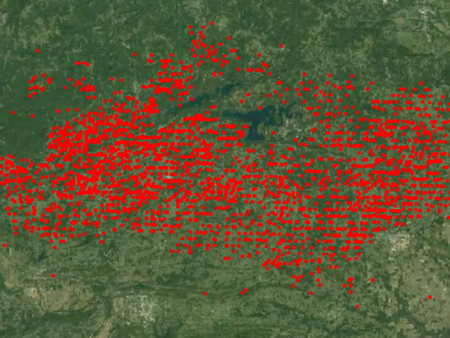
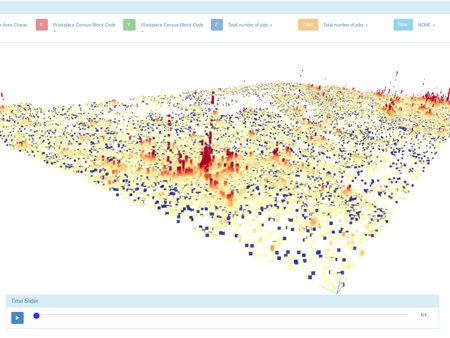
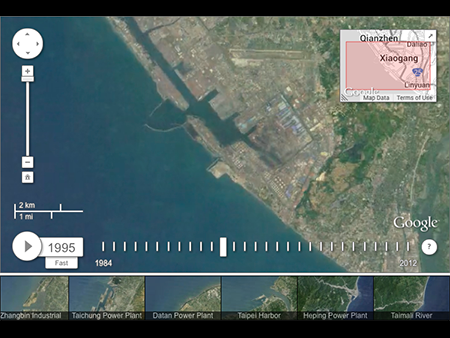
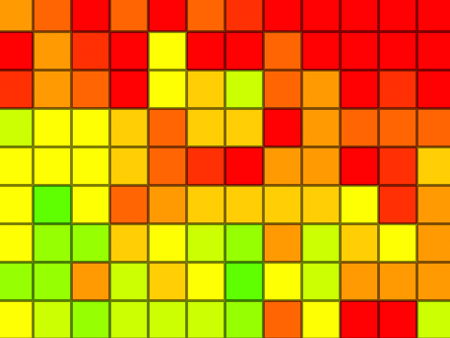
Fires at night
Explorable visualization of a wide variety of fires detected by VIIRS over a year.
Explorable Inequality
Explorable visualization of the World Top Incomes Database illustrating global income inequality.
FIRMS Timelapse
Visualization of thirteen years of MODIS fire location vector data overlayed on an explorable global timelapse.
Suburban Sprawl
Video exploring the growth of suburban sprawl in Chesterfield County, Virginia using Google Earth Timelapse to show the full scope of changes.
Drilling
Time series visualization of over one million natural resource extraction wells in eight states spanning decades.
Fracking Earthquakes
Visualization of Landsat and USGS data, utilizing Google Earth Timelapse to explore the possible connection in Arkansas between earthquakes and natural gas drilling.
EVA & LEHD
Multi-dimensional visualization of LEHD (Longitudinal Employer-Household Dynamics) data using EVA (Explorable Visual Analytics).
Timelapse Story Telling
Visualization exploring landscape changes along Taiwan's coastline over two decades using Google Earth Timelapse.
Air Quality Monitor Test
Performance comparision of six low-cost air quality monitors against an EPA-approved class III particle detector.
Speck Air Quality Test
Visualization of a Speck test showing how indoor air quality is effected by vacuuming, running an air purifier, and blowing out candles.
Speck In-Home Test
Visualization of air quality data collected by 64 Specks located in homes around the Pittsburgh area for a period of five days.
AirNow
Explorable visualization of AirNow PM 2.5 data showing changes in particle values and air quality across the United States.