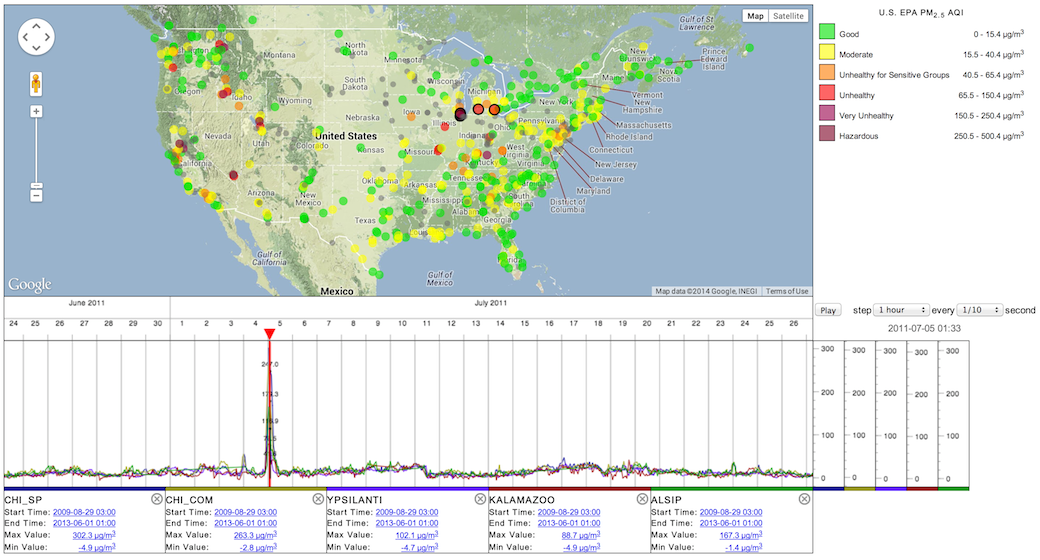
AirNow
This is a visualization of PM 2.5 data from 599 AirNow stations across the United States.
Use the link below to explore it yourself. Suggested explorations: zoom in on the timeline to the evening of July 4th 2010 or 2011 and then slowly move the red, triangular cursor back and forth to see the effects of fireworks. Or, zoom in to September 2-5, 2011 and move the cursor to see the effects of weather on the particles detected at stations on the eastern half of the country.