Air Quality Monitor Test Results
Introduction
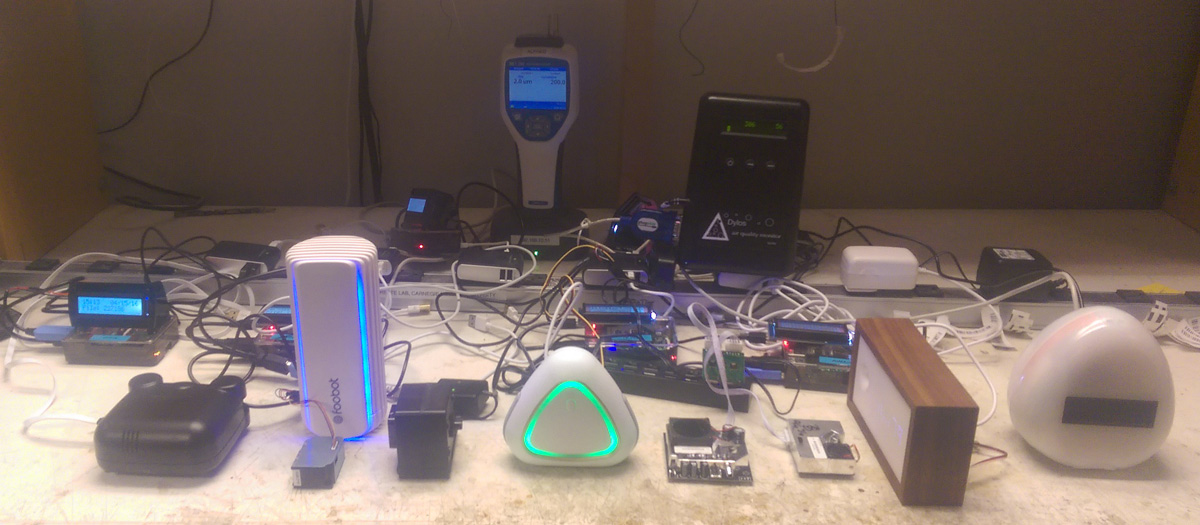
One year ago at SxSW we promised to collect air quality sensors and test them, openly publishing all data. Now we've purchased every low-cost sensor we can get our hands on, and we've done all the engineering necessary to get values recorded and timestamped — not easy in some cases. Here are all the sensors in our calibration space, where they ran for two days straight while we generated multiple daytime particulate peaks. Below are notes on each sensor, including three types of graphs: two-day views show all the data for 80 hours; one-day views showing 11 hours; and one-peak views showing one 1.5 hour peak. We compare values to the Grimm EDM 180, our EPA-approved class III instrument.

Air Quality Egg PM
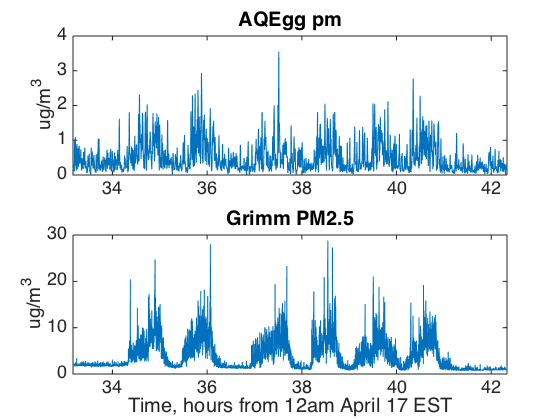
The Air Quality Egg PM samples rapidly, every five seconds, but exhibits the noisiest signal out of all the devices we tested. You can just make out the daytime peaks, but notice that peaks exist all night long also, when the Grimm reports consistently clean air.


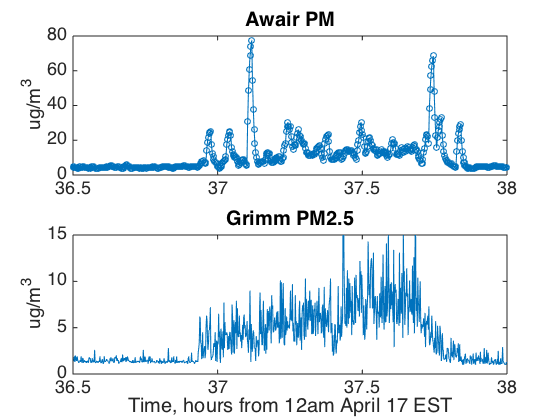
Awair
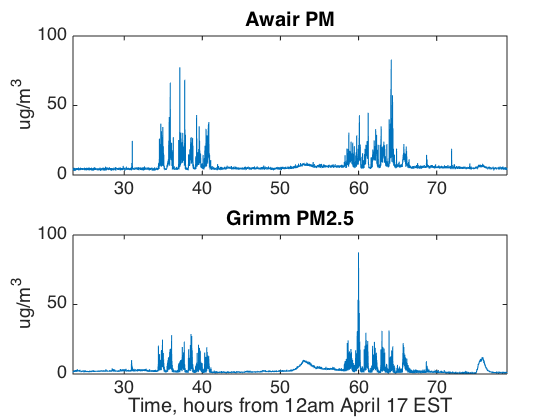
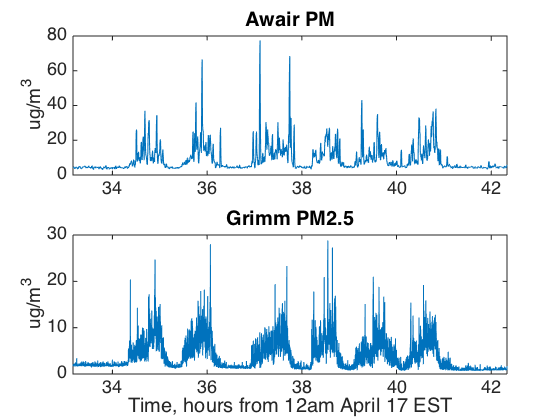
Awair picks up dirty air peaks very well, and demonstrates low values when the Grimm reports clean air, such as overnight. Some individual spikes are disproportionately high, and the 1.5 hour view shows that Awair detects single peaks, but not with the same shape as the Grimm.
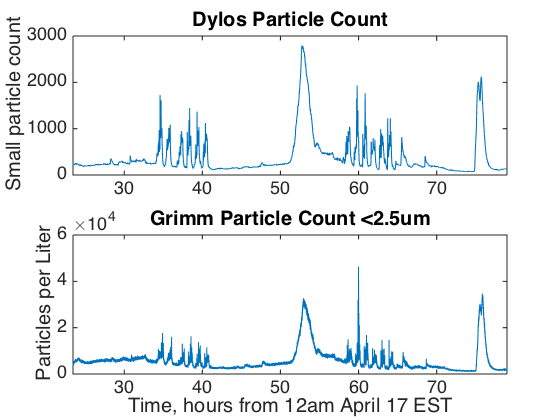
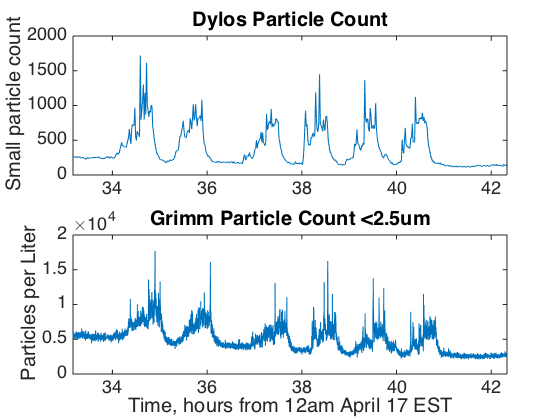
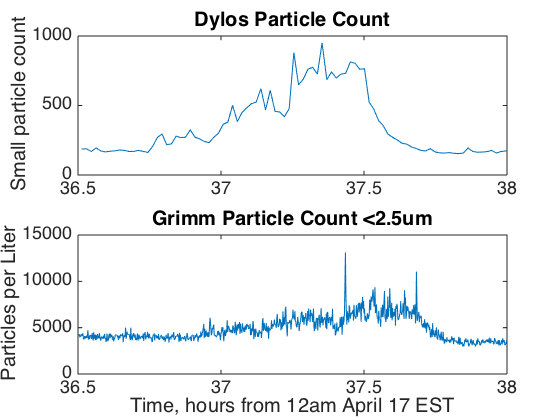
Dylos DC1100 Pro
The Dylos DC1100 Pro does an excellent job of matching the Grimm at all three zoom levels. It is unique among these sensors in reporting particle counts rather than just mass, so we compare it against the Grimm count of all particles of size 2.5 microns and below. In general, the Dylos appears to be a good proxy for more expensive particle count monitors.
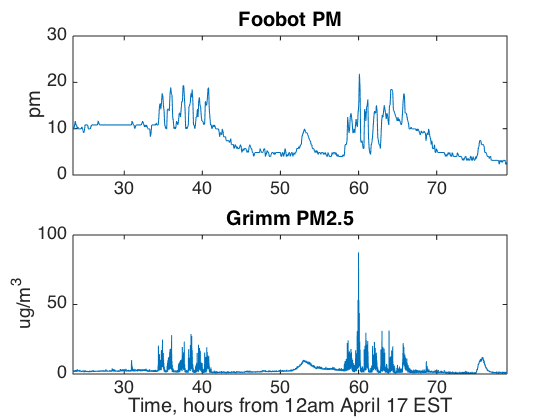
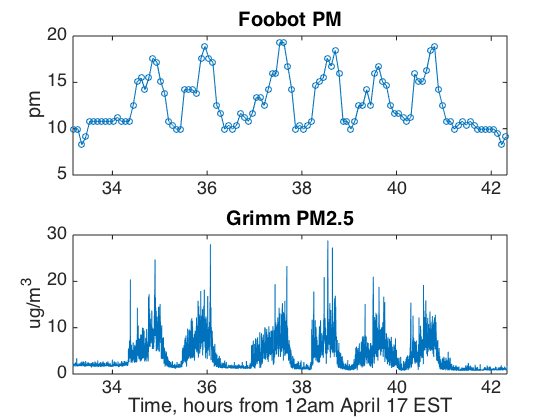
Foobot
The Foobot samples infrequently, once every five minutes. Because Foobot's algorithm changes over time (marketed as on-line learning), notice how the baseline shifts over time, between days. Its relative values certainly see the peaks, but the baseline is not consistently matching the Grimm because of the learning algorithm's dynamics.

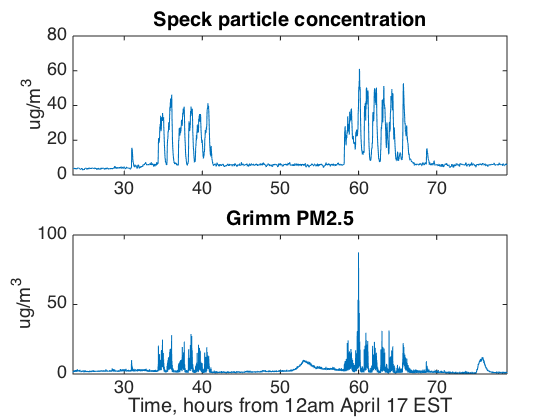
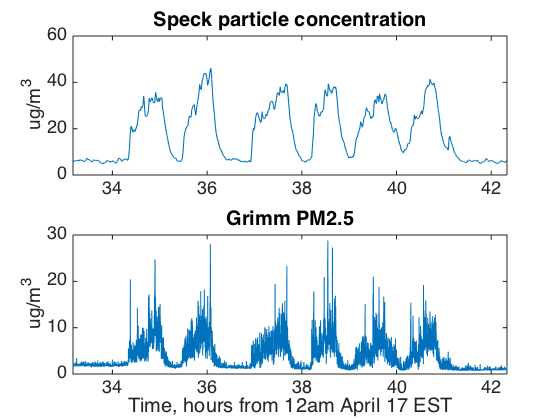
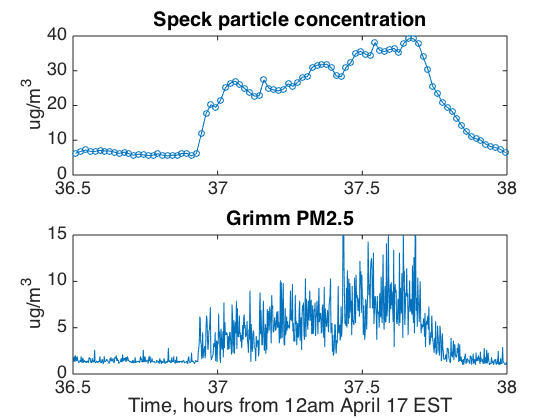
Speck
The Speck correlates well with the Grimm across all three zoom levels. Speck notices the single-peak event exactly when the Grimm measures the spike, at hour 36.8. NOTE: we are the CREATE lab, inventors the Speck. We created the spinoff that now sells Speck globally, so we are biased!
Issues in Evaluating Low-Cost Air Quality Monitors
Absolute error — Does the monitor approximately match local agency-operated air quality monitors? Are the values reported in units that can be compared against professional monitors, and are those values within the proper order of magnitude to what these monitors are reporting? Accuracy is important for being able to compare these monitors' readings with regional readings. Likewise, accuracy provides context for the risk posed by the measured particles.
Correlation — Does the monitor's behavior match the shape of reference instruments such as the Grimm EDM 180 used in this experiment? Often, the shape of particle events can provide insight into the source of the measured particles. If the particle levels rise very sharply, the source may be in the immediate vicinity. Very gradual changes may be regional or may be a result of diffusion from outside the home. Likewise, the rate of decrease can indicate the effectiveness of air purifiers or ventilation solutions.
Response time and stability — Does the monitor respond quickly to changes in air quality events? This is tied closely to sample rate, or how often the device collects a measurement. A longer sample rate may allow for more stability in the measurement, as the sample will typically collect data over the entire interval between the present and prior reading, but more acute changes in particle concentration may not be recorded as unique events. Sample rates that are too fast can result in noisy behavior because the monitors cannot ingest as many particles per sample.
Baseline behavior — Does the behavior of the monitor reflect changes in baseline (clean) air quality? Most monitors are able to identify acutely elevated particle concentrations, but for the purpose of understanding long-term air quality trends, the monitor must also exhibit precision during periods of low concentration.